<script type="text/javascript+protovis">
var bullets = [
{
title: "Revenue 2005 YTD",
subtitle: "US$, in thousands",
ranges: [150, 225, 300],
measures: [270],
markers: [250]
}
];
var vis = new pv.Panel()
.data(bullets)
.width(200)
.height(30)
.margin(20)
.left(120);
var bullet = vis.add(pv.Layout.Bullet)
.orient("left")
.ranges(function(d) d.ranges)
.measures(function(d) d.measures)
.markers(function(d) d.markers);
bullet
.range.add(pv.Bar)
.fillStyle(pv.Scale.linear(0, 150, 225, 300).range('#fb0f00','#fb0f00','yellow', '#19d700'));
bullet.measure.add(pv.Bar).fillStyle("black");
bullet.marker
.add(pv.Dot)
.shape("tick")
.strokeStyle("white")
.lineWidth(2)
.top(28)
.size(26)
.fillStyle("white");
bullet.tick.add(pv.Rule)
.anchor("bottom")
.add(pv.Label)
.text(bullet.x.tickFormat);
bullet.anchor("left").add(pv.Label)
.font("bold 12px sans-serif")
.textAlign("right")
.textBaseline("bottom")
.text(function(d) d.title);
bullet.anchor("left").add(pv.Label)
.textStyle("#666")
.textAlign("right")
.textBaseline("top")
.text(function(d) d.subtitle);
vis.render();
</script>
 |
| Protovis - Bullet Chart (Horizontal) |
Alternative 2 (Vertical)
<script type="text/javascript+protovis">
var bullets = [
{
title: "Revenue 2005 YTD",
subtitle: "US$, in thousands",
ranges: [150, 225, 300],
measures: [270],
markers: [250]
}
];
var vis = new pv.Panel()
.data(bullets)
.width(30)
.height(200)
.margin(20)
.left(50)
.right(50)
.bottom(30);
var bullet = vis.add(pv.Layout.Bullet)
.bottom(-20)
.orient("bottom")
.ranges(function(d) d.ranges)
.measures(function(d) d.measures)
.markers(function(d) d.markers);
bullet
.range.add(pv.Bar)
.fillStyle(pv.Scale.linear(0, 150, 225, 300).range('#fb0f00','#fb0f00','yellow', '#19d700'));
bullet.measure.add(pv.Bar).fillStyle("black");
bullet.marker
.add(pv.Dot)
.shape("tick")
.strokeStyle("white")
.lineWidth(2)
.left(2)
.size(26)
.fillStyle("white");
bullet.tick.add(pv.Rule)
.anchor("right")
.add(pv.Label)
.text(bullet.x.tickFormat);
bullet.anchor("top").add(pv.Label)
.font("bold 12px sans-serif")
.textAlign("center")
.textBaseline("bottom")
.text(function(d) d.title);
bullet.anchor("top").add(pv.Label)
.textStyle("#666")
.textAlign("center")
.textBaseline("top")
.text(function(d) d.subtitle);
vis.render();
</script>
 |
| Protovis - Bullet Chart (Vertical) |
Alternative 3 (Vertical)
<script type="text/javascript+protovis">
var bullets = [
{
title: "Revenue 2005 YTD",
subtitle: "US$, in thousands",
ranges: [150, 225, 300],
measures: [270],
markers: [250]
}
];
var vis = new pv.Panel()
.data(bullets)
.width(30)
.height(200)
.margin(20)
.left(50)
.right(50)
.bottom(30);
var bullet = vis.add(pv.Layout.Bullet)
.bottom(-20)
.orient("bottom")
.ranges(function(d) d.ranges)
.measures(function(d) d.measures)
.markers(function(d) d.markers);
bullet
.range.add(pv.Bar)
.fillStyle(pv.Scale.linear(0, 150, 225, 300).range('#fb0f00','#fb0f00','yellow', '#19d700'));
bullet.measure.add(pv.Bar).fillStyle("black");
bullet.marker
.add(pv.Dot)
.shape("tick")
.strokeStyle("white")
.lineWidth(2)
.left(2)
.size(26)
.fillStyle("white");
bullet.tick.add(pv.Rule)
.left(function(d) -6)
.anchor("left")
.left(-5)
.add(pv.Label);
bullet.anchor("top").add(pv.Label)
.font("bold 12px sans-serif")
.textAlign("center")
.textBaseline("bottom")
.text(function(d) d.title);
bullet.anchor("top").add(pv.Label)
.textStyle("#666")
.textAlign("center")
.textBaseline("top")
.text(function(d) d.subtitle);
vis.render();
</script>
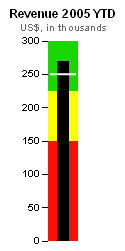 |
Protovis - Bullet Chart (Vertical) |
No comments:
Post a Comment